
How High Can Stocks Go?
7 January 2011
While this analysis is based on the S&P 500 Index, it indirectly applies to all economic expansion and inflation-protection assets, such as copper, oil, silver, and gold. If stocks are making higher highs, inflation-protection assets will most likely come along for the ride.
We study the S&P 500 since it remains the most widely-accepted vehicle to monitor market participants' acceptance of or aversion to risk. Similarly, the S&P 500 helps us monitor the ongoing battle between global inflationary and deflationary forces. When money printing and economic expansion rule the day, the S&P 500 tends to be healthy. When excessive levels of global debt, unfunded entitlements, bloated housing inventories, and economic weakness are front and center, the S&P 500 tends to be weak.
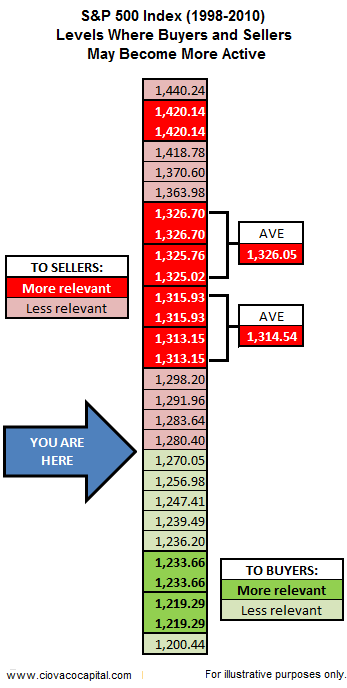
As we outlined in our 2011 Investment Outlook, the S&P 500 recently cleared several key levels, which leaves the door open to the possibility of higher highs in stocks. This analysis looks at market levels that piqued the interest of both buyers and sellers between 1998 and 2011. We studied weekly and monthly charts looking at intra-day highs and lows, as well as closing prices. The table below summarizes the results, focusing on market levels that have the highest probability of impacting asset prices.
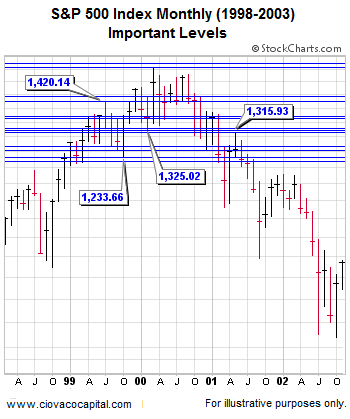
The chart below highlights important levels from a monthly perspective. There are numerous ways to determine possible areas of support and resistance. Therefore, other levels may, and most likely will, come into play over the coming months.
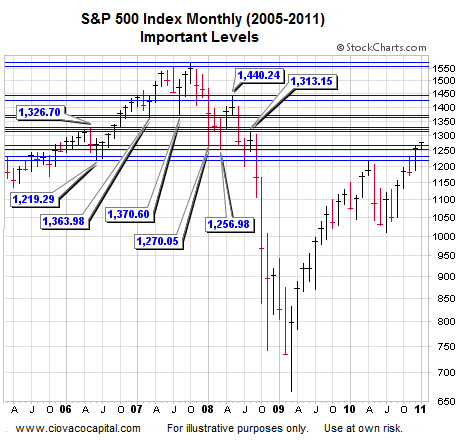
The same concept is presented below with a different time frame. Notice on the right side of the chart, the present day market may have some more room to run in terms of the most relevant levels of resistance.
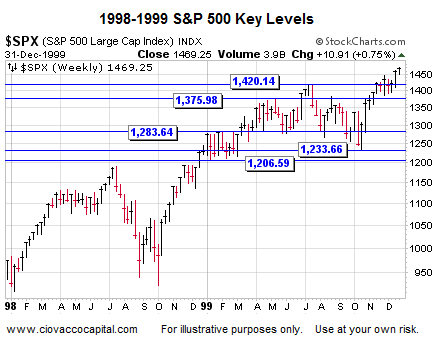
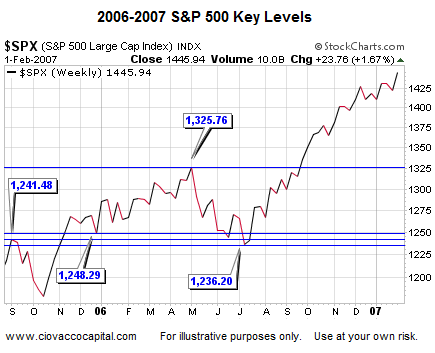
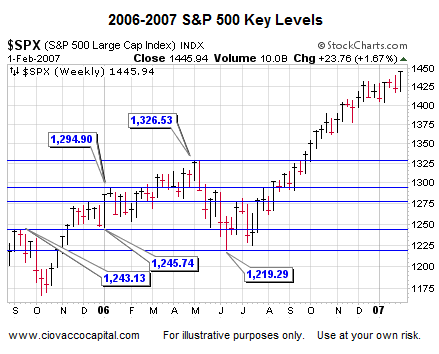
The following charts are weekly charts identifying key S&P 500 levels in a little more detail than shown in the summary table above. If you bookmark this article, it may be helpful to check back from time-to-time as the market advances or declines.
While not all that important since they marked relatively short reversals, the S&P 500 does have to contend with 1,275.09 and 1,279.64 in the short-run (see below).
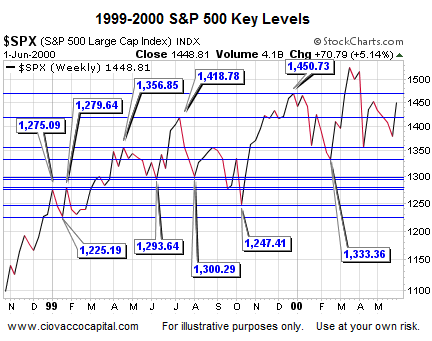
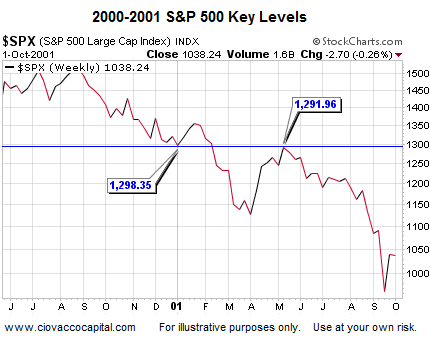
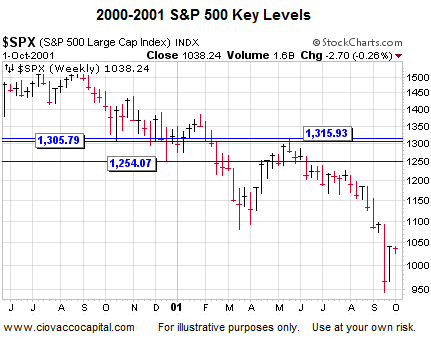
The chart above looks at closing prices. The chart below is based on intra-day highs and lows. All three are relevant to market participants.
The analysis above can help both bulls and bears alike since it identifies areas of possible support should market participants begin to refocus their attention on the deflationary side of the coin. The market's upside potential, even under positive circumstances, may not be met until some form of corrective activity or consolidation takes place. Bullish sentiment needs to be monitored and remains a yellow flag for the markets
No comments:
Post a Comment